

ArcGIS Utility Network: Data Builds – Sanitary Sewer
In today’s utility network article, we will examine a few of the various types of data builds that are possible in Utility Network, focusing specifically on the genre of sanitary sewer networks.
One of the products that are available in the utility network solutions packages are a robust set of modern GIS symbols. These symbols are also set with various scale ranges and visible field settings to demonstrate how corporations may wish to start their utility network experience. Lets examine the map scaling and symbology using ESRI’s Naperville sanitary sewer data.
In our first image we see a common GIS view of sewer pipes and maintenance holes, apart from the specific symbols used this is a view that most users of sanitary sewer data in GIS will be familiar with.

You’ll notice if we zoom in that our symbology has changed. Why?
One of the concepts within utility network is associations. Associations allow us to model the world in GIS with much more detail, and one of the challenges with more detail becomes map clutter. To reduce map clutter, associations have a setting that allows the asset visibility to be toggled on/off. Another option to reduce map clutter is using symbol scaling to turn assets on/off at various scales, which is what we see above. When we zoom from the scale in the first image to the scale in the second image, we have triggered a symbol scaling setting. The author of the map has designed a small-scale view of the data versus a large scale view of the data. We can zoom in even closer to get a more detailed view of this site.
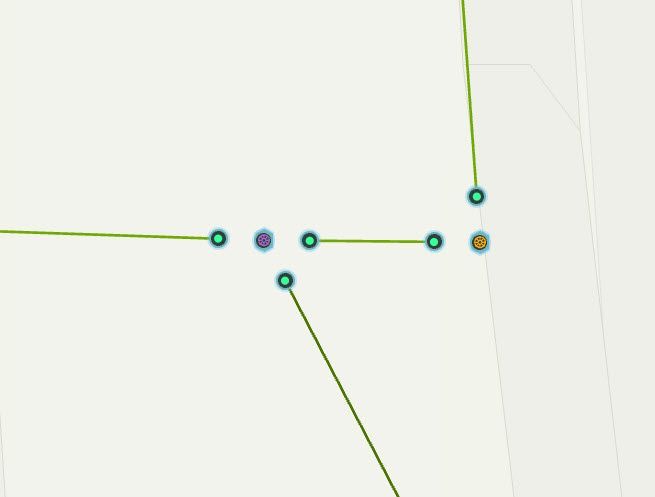
This view of the data may not look very familiar to existing GIS users. We see pipes and maintenance holes, but they don’t appear attached – in geometric networks everything must be attached. And what are the points on the end of each pipe? Let’s start to work through this view.
First, it should be noted in the image above the Naperville data is built with maintenance holes and vaults on top of each other, the premise for this construction is that a vault is an asset point with an internal function and pipe connection points. The vault serves multiple purposes (channel flow and pipe connection) and requires more than the traditional single point to model properly. On the ArcGIS Pro Utility Network toolbar lets select a manhole location and enter containment. Recall from previous articles, we know we are in containment mode on an asset when we see the dashed blue line around it, as shown below. Additionally, on the Utility Network toolbar let’s set ‘View Associations’ to true, and arrive at the image below.
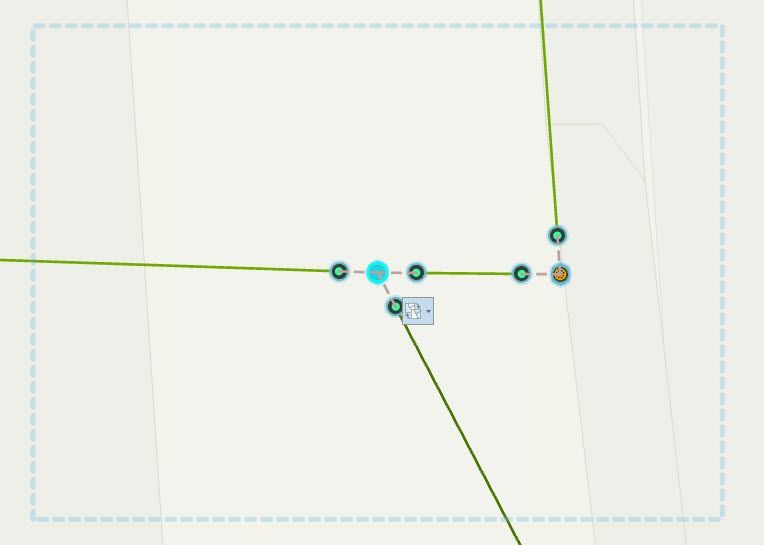
From the image above we can see that the points at the ends of the pipes are associated with the manholes. This is consistent with the new utility network high fidelity data build. The points at the ends of the pipes are from the Sewer Device feature class, the Asset Group is Connection, and the Asset Type is Pipe Connection, so these are the points where the pipe connects to something - in this case it is the manhole. We know the pipe is connected to the manhole because we see an association is present (dashed brown line between pipe ends and manhole). So, as far as utility network is concerned, the assets are indeed connected through associations and the data is fully enabled to perform flow trace analysis.
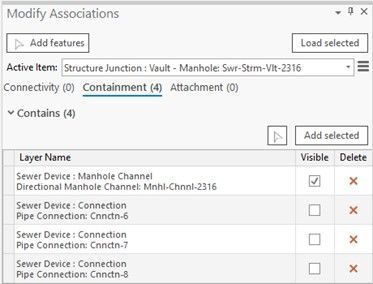
If we view the associations of this site, we see that the Structure Junction > Vault > Manhole contains four assets: one manhole channel and three pipe ends.
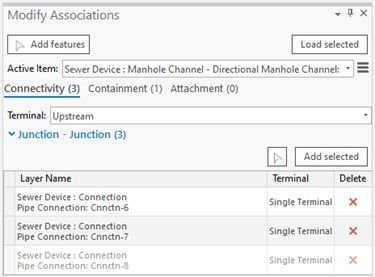
Additionally we can select the manhole and see the connectivity associations associated with that asset. In the image below we see that the manhole has a connectivity association with three pipe connection points.
In our examples above we see a standard approach for utility network high fidelity data in a sanitary sewer system. GIS data editors would be expected to construct and maintain data using the components we discussed above.
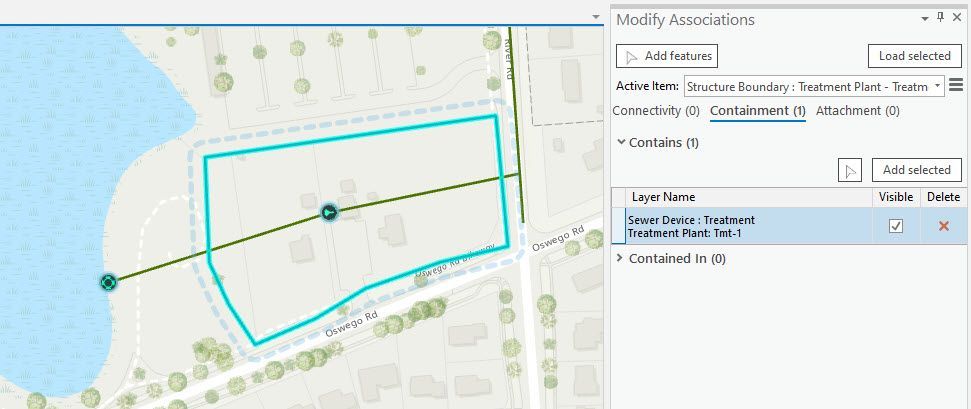
Let’s look at another example, this time we will look at a treatment plant. In the image below we’ve navigated to a sewage treatment facility, and have selected the polygon boundary that delineates the site. The feature class is Structure Boundary, the Asset Group is Sewer Treatment Plant Boundary, and the Asset Type is Treatment Plant. Once again, we can select the polygon and activate containment. We see that the treatment plant polygon contains one point – the treatment plant point. More specifically the point feature class is Sewer Device, the Asset Group is Treatment, and the Asset Type is Treatment Plant. The treatment plant boundary contains a treatment plant facility point.
If we use the Explorer tool in ArcGIS Pro we can view the attributes of the treatment plant point, in the image below we see the attributes of this point.

If you recall our article on Subnetworks, you will notice in the attributes that this point is acting as a subnetwork controller. In the attributes we see that the subnetwork controller attribute is set as true. This means that the site has already been validated successfully and built into a subnetwork. The point has a subnetwork controller name, and the terminal setting is shown and the subnetwork has a name. This treatment plant point is serving as a subnetwork control point (sink) that will pull flow and trace analysis towards it, as we would expect in a sewage treatment plant. You can also see that downstream of this plant is an outlet that discharges into the adjacent water body.
In this article we have shown multiple sites that demonstrate many of the new technologies found in utility network, these new technologies help us model the world in much more detail that previous generations of GIS. Many of these new tools and relationships will be new to existing GIS users. Data caretakers will need to learn these new components of GIS and understand new requirements to create, edit and maintain data in a utility network.
Acorn Information Solutions launched its MonARC Data Migration platform to help corporations implement, or migrate to, a Utility Network. AIS has decades of experience in creating and administering municipal and utilities based Geometric Networks combined with knowledge and experience in Utility Network migrations.
About the Author
Craig Martin is Acorn’s Municipal and GIS Manager and has over 25 years of experience in the field of GIS. Craig has extensive experience in data modeling, data capture, administration, solutions architecture, and smart data networks in a variety of engineering disciplines. Connect with one of our experts at info@acorninfosolutions.ca.