

ArcGIS Utility Network: Terminals
In today’s Utility Network article, we delve deeper into the topic of Terminals
Existing GIS users that are familiar with Geometric Networks should understand the technology behind sources and sinks. This advancement in GIS enabled a significant leap in what GIS was capable of and brought the technology into new sectors, such as municipalities and utilities. In the Utility Network, Terminals have advanced the technology even further.
What are Terminals?
Terminals represent ports, entry or exit locations, on a device or junction and they can be set as subnetwork controllers to define the origin of a subnetwork. Terminals can define resource pathways within a feature and from those pathways valid choices can be made by the resource flow depending on different states of the controller. While sources and sinks in the Geometric Network had quite limited capabilities beyond the push/pull effect of the resource, terminals provide a comprehensive modeling capability that allows for a much more detailed level of asset configuration and resource flow.
To better understand terminals, we can examine a common GIS asset like a water distribution control valve. There are many different types of water control valves that are used for various activities, but some of the common components are inlet and outlet port(s) that shape a resource flow for a variety reasons. With terminals we can now model these ports within the asset point.

Another example of real-life assets that can be modeled in much greater detail are transformers in an electrical distribution network. In this example, we have a common single phase pole mounted transformer that have traditionally been modeled in Geometric Networks as a single point. With terminals, we can now model high side and low side terminals.
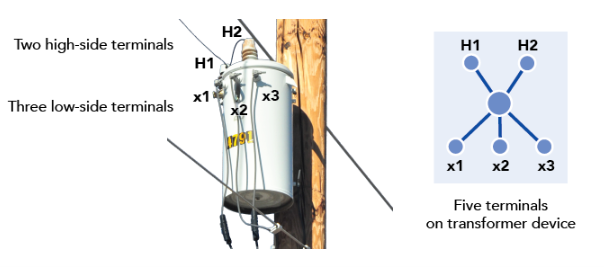
With Utility Network terminals, the asset shown above can be edited with five terminals (two high side, three low side) or a more simplified configuration of one high side terminal and one low side terminal (shown below). We have more detailed asset types and configurations, and we also have flexibility with how detailed a GIS can be. This flexibility can be referred to as high fidelity data versus low fidelity data.
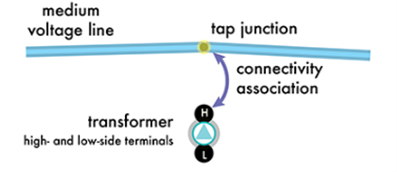
In the example below this same transformer is modeled using only two ports (high side versus low side), also notice that it makes use of a connectivity association between the tap junction on the medium voltage line and the transformers high side port. We discussed associations in a previous utility network article.
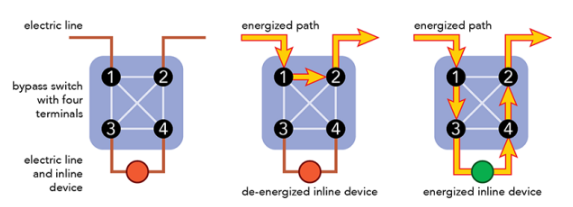
How terminals are defined depends on the asset type, the fidelity of the data model, if the resource flow is impacted by the asset, the number of ports, whether the ports are distinctly different, if the resource flow originates at the asset or terminates at the asset. Let’s examine a more complex scenario to illustrate the power of terminal configurations and output analysis. Specifically, we will examine a bypass switch.
The device shown below is a four-terminal device (utility network allows for a maximum of eight terminals) which therefore allows us six possible paths between these terminals, but the valid paths defined in the terminal configuration either energize or deenergize the inline device (such as a voltage regulator).
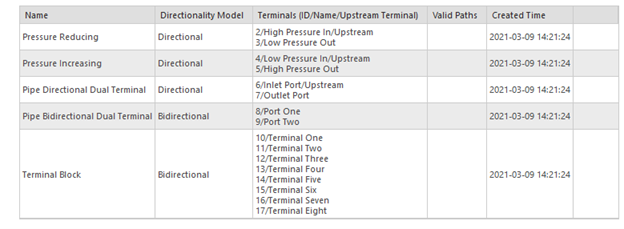
ESRI’s base asset packages all come with many common terminal configurations already defined, but users also have the ability to create new terminal configurations that suit non-typical scenarios. Anyone intending to create new terminal configurations will need to spend time planning and testing various terminal builds; another example of why modern GIS also requires a sandbox environment. Since terminals impact traversability-based traces they require careful consideration from the GIS administrator when creating new terminal configurations as well as the GIS data editor when placing features.
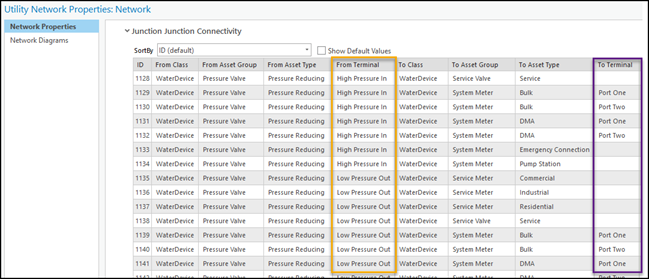
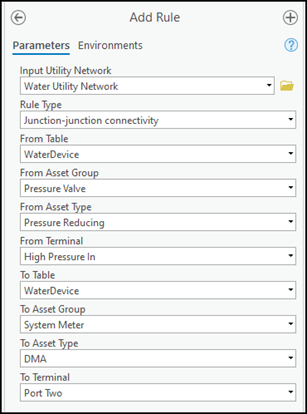
While terminals are not actually features that appear on a map, they still exist as connection locations on a device or junction, and certain types of network rules can be defined at the terminal level. Recall that we discussed network rules in a previous article. By incorporating rules at the terminal level this creates an increased level of data integrity during the data editing and validation process, helping to ensure a comprehensive resource network that is error free.
Terminals in Utility Network represent a notable change in the foundation of network mechanics, maintenance and analysis. Anyone working in the field of GIS and is involved with trace networks will need to understand how terminals work and shape network analysis. Data editors will need to understand how terminals work so they can create and maintain data, and subnetworks, with accuracy and integrity. GIS administrators will need to understand how terminals work and are configured so they can model new terminals in the database when they are required. Corporations that are already GIS enabled and will be migrating their datasets to utility network will need to plan this data migration and terminals will be an important component of that migration plan.
We launched MonARC Data Migration platform to help corporations implement, or migrate to, a Utility Network. Acorn has decades of experience in creating and administering municipal and utilities based Geometric Networks combined with knowledge and experience in Utility Network migrations.
About the Author
Craig Martin is Acorn’s Municipal and GIS Manager and has over 25 years of experience in the field of GIS. Craig has extensive experience in data modeling, data capture, administration, solutions architecture, and smart data networks in a variety of engineering disciplines.
Connect with one of our experts at info@acorninfosolutions.ca.